


Trend All the Fucking Time (TRAFT?)
My new years resolution was to measure more. For a while now, I've wanted to get a better picture of our systems and our business, and hopefully, how they relate.
So, my first day back at work after the holidays, I started looking for the right tool to gather data with. After investigating some of the options, I wound up settling on munin.
I say settling because I was quite dissatisfied with the available options. I tried everything from collectd to reconnoiter and found all of the solutions horribly lacking in some way. This is an enormous market just waiting for a startup to revolutionize it.
In any event, we were already using munin to trend our system metrics. So, now it was just a matter of figuring out how to get our business metrics in there. Here's how we did it.
Custom Graphs
It's actually relatively easy to write a munin plugin. All you need is an executable that responds to a config command and emits a specially formatted value when it's called with no parameters.
Most of the examples I could find were implemented using multi-line strings, which seemed ugly to me. So, I wrote a little ruby DSL to make my plugins easier on the eyes.
Here's an example plugin written with munin_plugin. I won't go in to what all the parameters mean. The official documentation does a good enough job of that.
#!/usr/bin/env ruby

require 'rubygems' # or rip or whatever
require 'munin_plugin'

munin_plugin do
  graph_title  "Load average"
  graph_vlabel "load"
  load.label   "load"

  collect do
    load.value `cat /proc/loadavg`.split(" ")[1]
  end
end
Everything outside the collect block gets emitted as configuration. When the above script is called with config, it produces the following output:
graph_title Load average
graph_vlabel load
load.label load
When it's called without any parameters, it would produce something like the following:
load.value 0.03
As you can see, the DSL just emits whatever you give it, essentially verbatim. Nothing fancy, just a little syntactic sugar.
Let's trend some business metrics.
Trending Business Metrics
One of our most popular features is picture uploads. I wanted to get a sense of how quickly pictures were being uploaded at different times of day. Since munin polls nodes every 5 minutes, I wasn't sure exactly what kind of value it was going to need to get this going. Do I need to calculate the rate myself?
It turns out munin has an option called DERIVE, which turns your monotonically increasing value in to a per unit of time graph. So, I created a little REST API that returns the total number of pictures on the site. Then, all I had to do was scoop it up with a fairly simple munin plugin.
#!/usr/bin/env ruby

require 'rubygems'
require 'munin_plugin'
require 'open-uri'

munin_plugin do
  graph_title    "Picture Upload Rate"
  graph_vlabel   "Pictures / ${graph_period}"
  graph_category "FetLife"
  graph_period   "minute"
  pictures.type  "DERIVE"
  pictures.min   "0"
  pictures.label "pictures"

  collect do
    pictures.value open("http://an.internal.ip/stats?id=pictures").read
  end
end
Here's the result (actually for a different metric, but it uses roughly the same script):
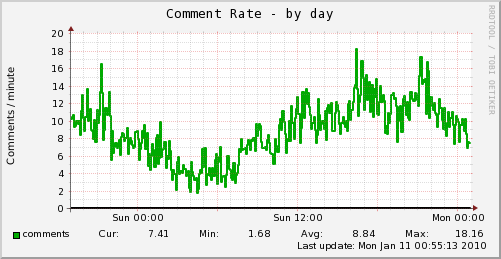
We use a nearly identical plugin to chart the all the critical objects in our system. The graphs are starting to give us a nice look at exactly what happens during peak load, and as time goes on, hopefully they'll assist us in identifying problems, too.
The moral of the story is that seting up custom graphs is easy. You should do it.